Preamble
- This post is an extract of the book "Data Preparation for Machine Learning" from Jason Brownlee.
Chapter 4: Data Preparation Without Data Leakage
- Naive application of data preparation methods to the whole dataset results in data leakage that causes incorrect estimates of model performance.
- Data preparation must be prepared on the training set only in order to avoid data leakage.
- Normalize data: scale input variables to the range 0-1
- Standardization estimates the mean and standard deviation values from the domain in order to scale the variables.
- The k-fold cross-validation procedure generally gives a more reliable estimate of model performance than a train-test split.
Part III: Data Cleaning
Chapter 5: Basic Data Cleaning
- Identify Columns that contain a Single Value
- Drop Rows
- Get duplicates
- Drop duplicates
Chapter 6: Outlier Identification and Removal
- Standard Deviation Method
- 1 standard deviation from the mean covers 68% of data
- 2 standard deviations from the mean covers 95 percent of data
- 3 standard deviations from the mean covers 99,7% of data
- Three standard deviations from the mean is a common cut-off in practice for identifying outliers in a Gaussian or Gaussian-like distribution.
- Interquartile Range Method
- Not all data is normal or normal enough to treat it as being drawn from a Gaussian distribution. A good statistic for summarizing a non-Gaussian distribution sample of data is the interquartile Range or IQR. The IQR is calculated as the difference between the 75th and 35th percentiles of the data and defines the box in a box and whisker plot.
- We can calculate the percentiles of a dataset using the percentile() NumPy function.
- Automatic Outlier Detection
- Each example is assigned a scoring of how isolated or how likely it is to be outliers based on the size of its local neighborhood.
- The scikit-learn library provides an implementation of this approach in the LocalOutlierFactor class.
- Standard deviation and interquartile range are used to identify and remove outliers from a data sample.
Chapter 7: How to Mark and Remove Missing Data
- Pandas provides the dropna() function that can be used to drop either columns or rows with missing data.
Chapter 8: How to Use Statistical Imputation
- Datasets may have missing values, and this can cause problems fro many machine learning algorithms. As such, it is good practice to identify and replace missing values for each column in your input data prior to modeling your prediction task. This is called missing data imputation, or imputing for short. A popular approach for data imputation is to calculate a statistical value for each column (such as a mean) and replace all missing values for that column with the statistic.
- Missing values must be marked with NaN values and can be replaced with statistical measures to calculate the column of values.
- The scikit-learn machine learning library provides the SimpleImputer class that supports statistical imputation.
- To correctly apply statistical missing data imputation and avoid data leakage, it is required that the statistics calculated for each column are calculated on the train dataset only, then applied to the train and test sets for each fold in the dataset. This can be achieved by creating a modeling pipeline where the first step is the statistical imputation, then the second step is the model. This can be achieved using the Pipeline class.
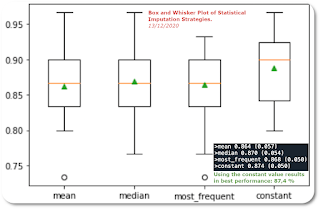
- Testing different imputed strategies. The author proposes to test different strategies when replacing data by comparing the mean, the median, the mode (most frequent) and constant(0) strategies.
Box and Whisper plot of different imputation strategies
- We can see that the distribution of accuracy scores for the constant strategy may be better than the other strategies.
Chapter 9: How to Use KNN Imputation
- Although any one among a range of different models can be used to predict the missing values, the k-nearest neighbor (KNN) algorithm has proven to be generally effective, often referred to as nearest neighbor imputation.
- Missing values must be marked with NaN values and can be replaced with nearest neighbor estimated values.
- An effective approach to data imputing is to use a model to predict the missing values.
- One popular technique for imputation is a K-nearest neighbor model. A new sample is imputed by finding the samples in the training set "closest" to it and averages these nearby points to fill in the value.
- The use of a KNN model to predict or fill missing values is referred to as Nearest Neighbor Imputation or KNN imputation.
- The scikit-learn machine learning library provides the KNNImputer class that supports nearest neighbor imputation.
- The KNNImputer is a data transform that is first configured based on the method used to estimate the missing values.
Chapter 10: How to Use Iterative Imputation
- Missing values must be marked with NaN values and can be replaced with iteratively estimated values.
- It is common to identify missing values in a dataset and replace them with a numeric value. This is called data imputing, or missing data imputation. One approach to imputing missing values is to use an iterative imputation model.
- It is called iterative because the process is repeated multiple times, allowing ever improved estimates of missing values to be calculated as missing values across all features are estimated. This approach may be generally referred to as fully conditional specification (FCS) or multivariate imputation by chained equations (MICE).
- Different regression algorithms can be used to estimate the missing values for each feature, although linear methods are often used for simplicity.
- The scikit-learn machine learning library provides the IterativeImputer class that supports iterative imputation.
Conclusion
- In this first three parts of the Data preparation for Machine Learning Book, we review the main data cleaning possibilities.
- The following part will be related to "Feature Selection".


Aucun commentaire:
Enregistrer un commentaire